The Brief
- A commercial property lender posted a strong quarter, a sign credit for real estate deals keeps flowing. Pluang
- A developer secured a loan for student housing near San Diego State, showing lenders still back student beds. Boston Real Estate Times
- A property lender plans to end its NYSE listing in early November, changing how investors can access it. finchannel
Market Snapshot
- 10-Year Treasury
- 5.09%-1 bps
- Benchmark for long-term property loans
- SOFR
- 3.89%+1 bps
- Base rate for floating-rate property loans (as of Oct 15)
- Real estate stocks (VNQ)
- $91.76+0.3%
- A fund holding about 150 REITs
Rates as of Oct 16 close. Full market data
REIT Weekly
REITs are companies that own income-producing property and trade like stocks, so they move with both rents and interest rates. The best and worst names each week hint at which property types investors favored.
- Best this week: DEI +5.1%, WELL +4.2%, O +3.5%
- Worst this week: HPP -14.0%, EQIX -3.9%, PLD -2.9%
- REIT yield vs. 10Y: VNQ yields 3.80%, -129 bps vs. the 10Y.
Week Ahead
There is no Fed meeting this week. The next one is Oct 28, so rate watchers have a quiet stretch to fill with housing data instead.
- Tue Oct 20: Housing starts (New Residential Construction), FRED
Careers Corner
When a mortgage REIT or property lender reports earnings, read past the headline number and look at its loan book. Check how many loans are current, how many are in trouble, and what kind of property backs them. That tells you where the lender sees risk and which markets it still trusts. For a student heading into real estate finance, learning to read a lender's quarterly report is a free skill to practice. It also gives you something concrete to discuss with anyone working in debt markets.
The Numbers
Every number is filled in automatically from public data.
Rates
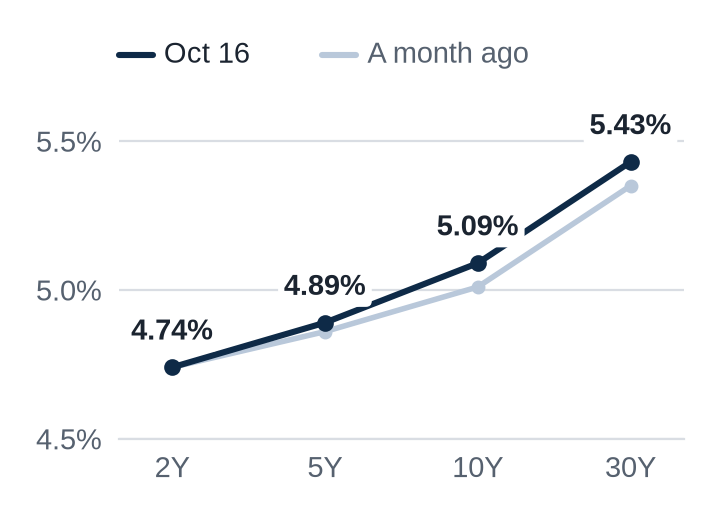
- 10-Year TreasuryBenchmark for long-term property loans
- 5.09%-1 bps
- 5-Year TreasuryBenchmark for many 5-year commercial mortgages
- 4.89%-2 bps
- 2-Year TreasuryTracks where the Fed is expected to set rates
- 4.74%-3 bps
- 10Y-2Y curveNegative = short-term rates above long-term, often a slowdown signal
- 35 bps+2 bps
- SOFRBase rate for floating-rate property loans (as of Oct 15)
- 3.89%+1 bps
- Fed FundsThe Fed's target for overnight bank lending; other rates key off it
- 3.75% to 4.00%0 bps
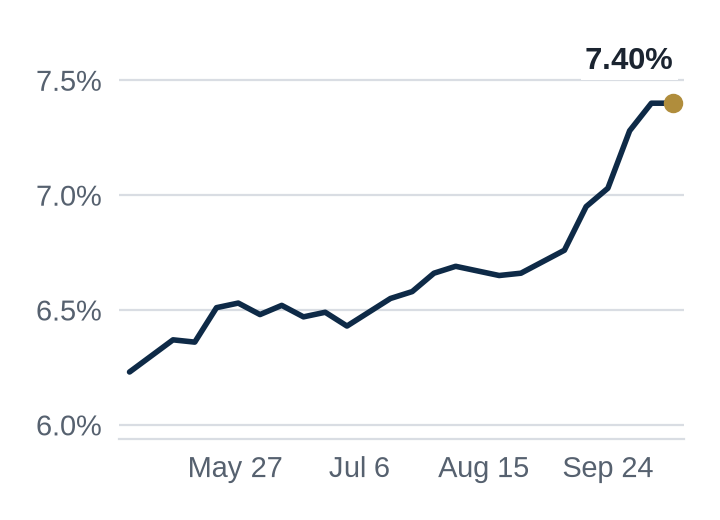
- 30-Year Mortgage30-year home mortgage rate (Freddie Mac); a housing-demand gauge, not a CRE loan rate (as of Oct 15)
- 7.40%0 bps
Rates as of Oct 16 close.

Federal Reserve
- FOMC: next Fed meetingWhen the Fed next decides on rates
- Oct 28
- Odds of a cutChance rates go down. Prediction-market odds from Polymarket traders
- 0.5%
- Odds of a holdChance rates stay the same
- 85.8%
- Odds of a hikeChance rates go up
- 13.7%
Kalshi: hold 85.2%

REITs
- Real estate stocks (VNQ)A fund holding about 150 REITs
- $91.76+0.3%
- Biggest gain todayOwns Los Angeles and Honolulu offices and apartments
- Douglas Emmett (DEI)+1.7%
- Biggest drop todayOwns West Coast offices and studios
- Hudson Pacific Properties (HPP)-7.8%
- REIT dividend yieldYearly income per $100 invested in VNQ
- 3.80%
- REIT yield vs. 10-Year TreasuryBelow zero: Treasuries out-yield REIT dividends, so REITs look pricey vs. bonds
- -129 bps

Term of the Day
CMBS
Commercial mortgage-backed securities. A bank bundles many property loans together, then sells slices of that pool to bond investors as securities. The investors collect the borrowers' loan payments. It lets lenders free up cash to make new loans, and it spreads property risk across many buyers.
Data Room
Slower-moving credit data. Rows marked Updated changed since the last issue.
- High-yield spread (Oct 15) UpdatedExtra interest risky companies pay over Treasuries; higher = lenders more nervous
- 3.23%-2 bps
- Bank CRE loans (Oct 7)Total commercial property loans banks hold
- $3,155B+0.2%
- Bank CRE delinquency (Q2 2026)Share of banks' commercial property loans that are behind on payments
- 1.53%-3 bps
- CMBS delinquency (Sept 2026)Share of commercial property loans in bonds that are behind on payments
- 8.02%+17 bps
Data checks: REIT prices came from a single source today. Treasury yields matched across FRED and Treasury.gov. Fed odds in line with Kalshi.
New issue every morning at creblurb.org.